For most of the history of music, humans produced sounds out of natural materials — rubbing together strings, hitting things, blowing air through tubes of various lengths. Until two things happened.
-
We understood the physics of sound. A sound is a combination of overlapping waves, and a wave is a kind of marvelous mathematical object that we can write theorems and prove things about and deeply and fundamentally understand.
Once we started understanding sound as a mathematical object, our vocabulary for talking about sound expanded in depth and precision. Architects could engineer the acoustical properties of a concert hall, and musicians could talk about different temperaments of tuning. We also advanced in our understanding of how humans perceive sounds.
-
We learned to relate our mathematical models to sounds in the real world. We built devices to record sound and decompose it into its constituent fundamental parts using the mathematical model of waves. We also invented a way to turn that mathematical model of a sound back into real notes we could hear, using electronics like oscillators and speakers.
This meant we could imagine new kinds of sounds as mathematical constructs, and then conjure them into reality, creating entirely new kinds of sounds we could never have created with natural materials. We could also sample sounds from the real world and modulate its mathematical structure. Not only that, backed by our mathematical model of sound, we could systematically explore the space of possible sounds and filters.
The instrument that results is a synthesizer.
Synthesizers
A synthesizer produces music very differently than an acoustic instrument. It produces music at the lowest level of abstraction, as mathematical models of sound waves. It begins with raw waveforms defined as oscillators, which get transmogrified through a sequence of filters and modulators before reaching our ears. It’s a way of producing sound by assembling it from logical components rather than creating it wholesale by hitting or vibrating something natural.
Because synthesizers are electronic, unlike traditional instruments, we can attach arbitrary human interfaces to it. This dramatically expands the design space of how humans can interact with music. Synthesizers can be connected to keyboards, sequencers, drum machines, touchscreens for continuous control, displays for visual feedback, and of course, software interfaces for automation and endlessly dynamic user interfaces.
With this, we freed the production of music from any particular physical form.
Synthesizers enabled entirely new sounds and genres of music, like electronic pop and techno. These new sounds were easier to discover and share because new sounds didn’t require designing entirely new instruments. The synthesizer organizes the space of sound into a tangible human interface, and as we discover new sounds, we could share it with others as numbers and digital files, as the mathematical objects they’ve always been.
The synthesizer is just one example of a pattern in the history of media: with breakthroughs in mathematical understanding of a medium, come new tools that exploit that mathematical understanding to enable new creative forms and human interfaces.
Optics, the mathematics of light and color, underpins so much of how humans interact with visual media today. Behind every image you see on screen is a color space like RGB or CMYK, a mathematical model of how we perceive color. We edit photos on our devices not by applying chemicals in a dark room but by passing our photographs through mathematical functions we call filters. This mathematical model of color and light also gave us new vocabulary (saturation, hue, contrast) and new interfaces (color curves, scopes, histograms) for working with the visual medium.
Recently, we’ve seen neural networks learn detailed mathematical models of language that seem to make sense to humans. And with a breakthrough in mathematical understanding of a medium, come new tools that enable new creative forms and allow us to tackle new problems.
Instruments for thought
In Prism, I discussed two new interface primitives enabled by interpretable language models:
- Detailed decomposition of concepts and styles in language. This is analogous to splitting a sound into its constituent fundamental waves. It takes a sentence like “A synthesizer produces music very differently than an acoustic instrument.” and decomposes it into a list of “features” like “Technical electronics and signal processing” and “Comparison between entities”.
- Precise steering of high-level semantic edits. I can take the same synthesizer sentence, add some “Discussions about parenthood”, and get “A parent often produces music differently from their children.”
In other words, we can decompose writing into a mathematical model of its more fundamental, constituent parts, and reconstruct those mathematical models of ideas back into text.
I spent some time imagining what kinds of wild and interesting interfaces may be possible as this nascent technology matures over time.
Heatmaps turn documents into terrain maps of concepts
In data visualization, a heatmap lets the user browse and navigate a very large area or dataset with ease by letting the eye quickly scan for areas with high or low values. Similarly, in the context of text documents, a heatmap can highlight the distribution of thematic elements, allowing users to quickly identify key topics and their prominence. Heatmaps can be particularly useful for analyzing large corpora or very long documents, making it easier to pinpoint areas of interest or relevance at a glance.
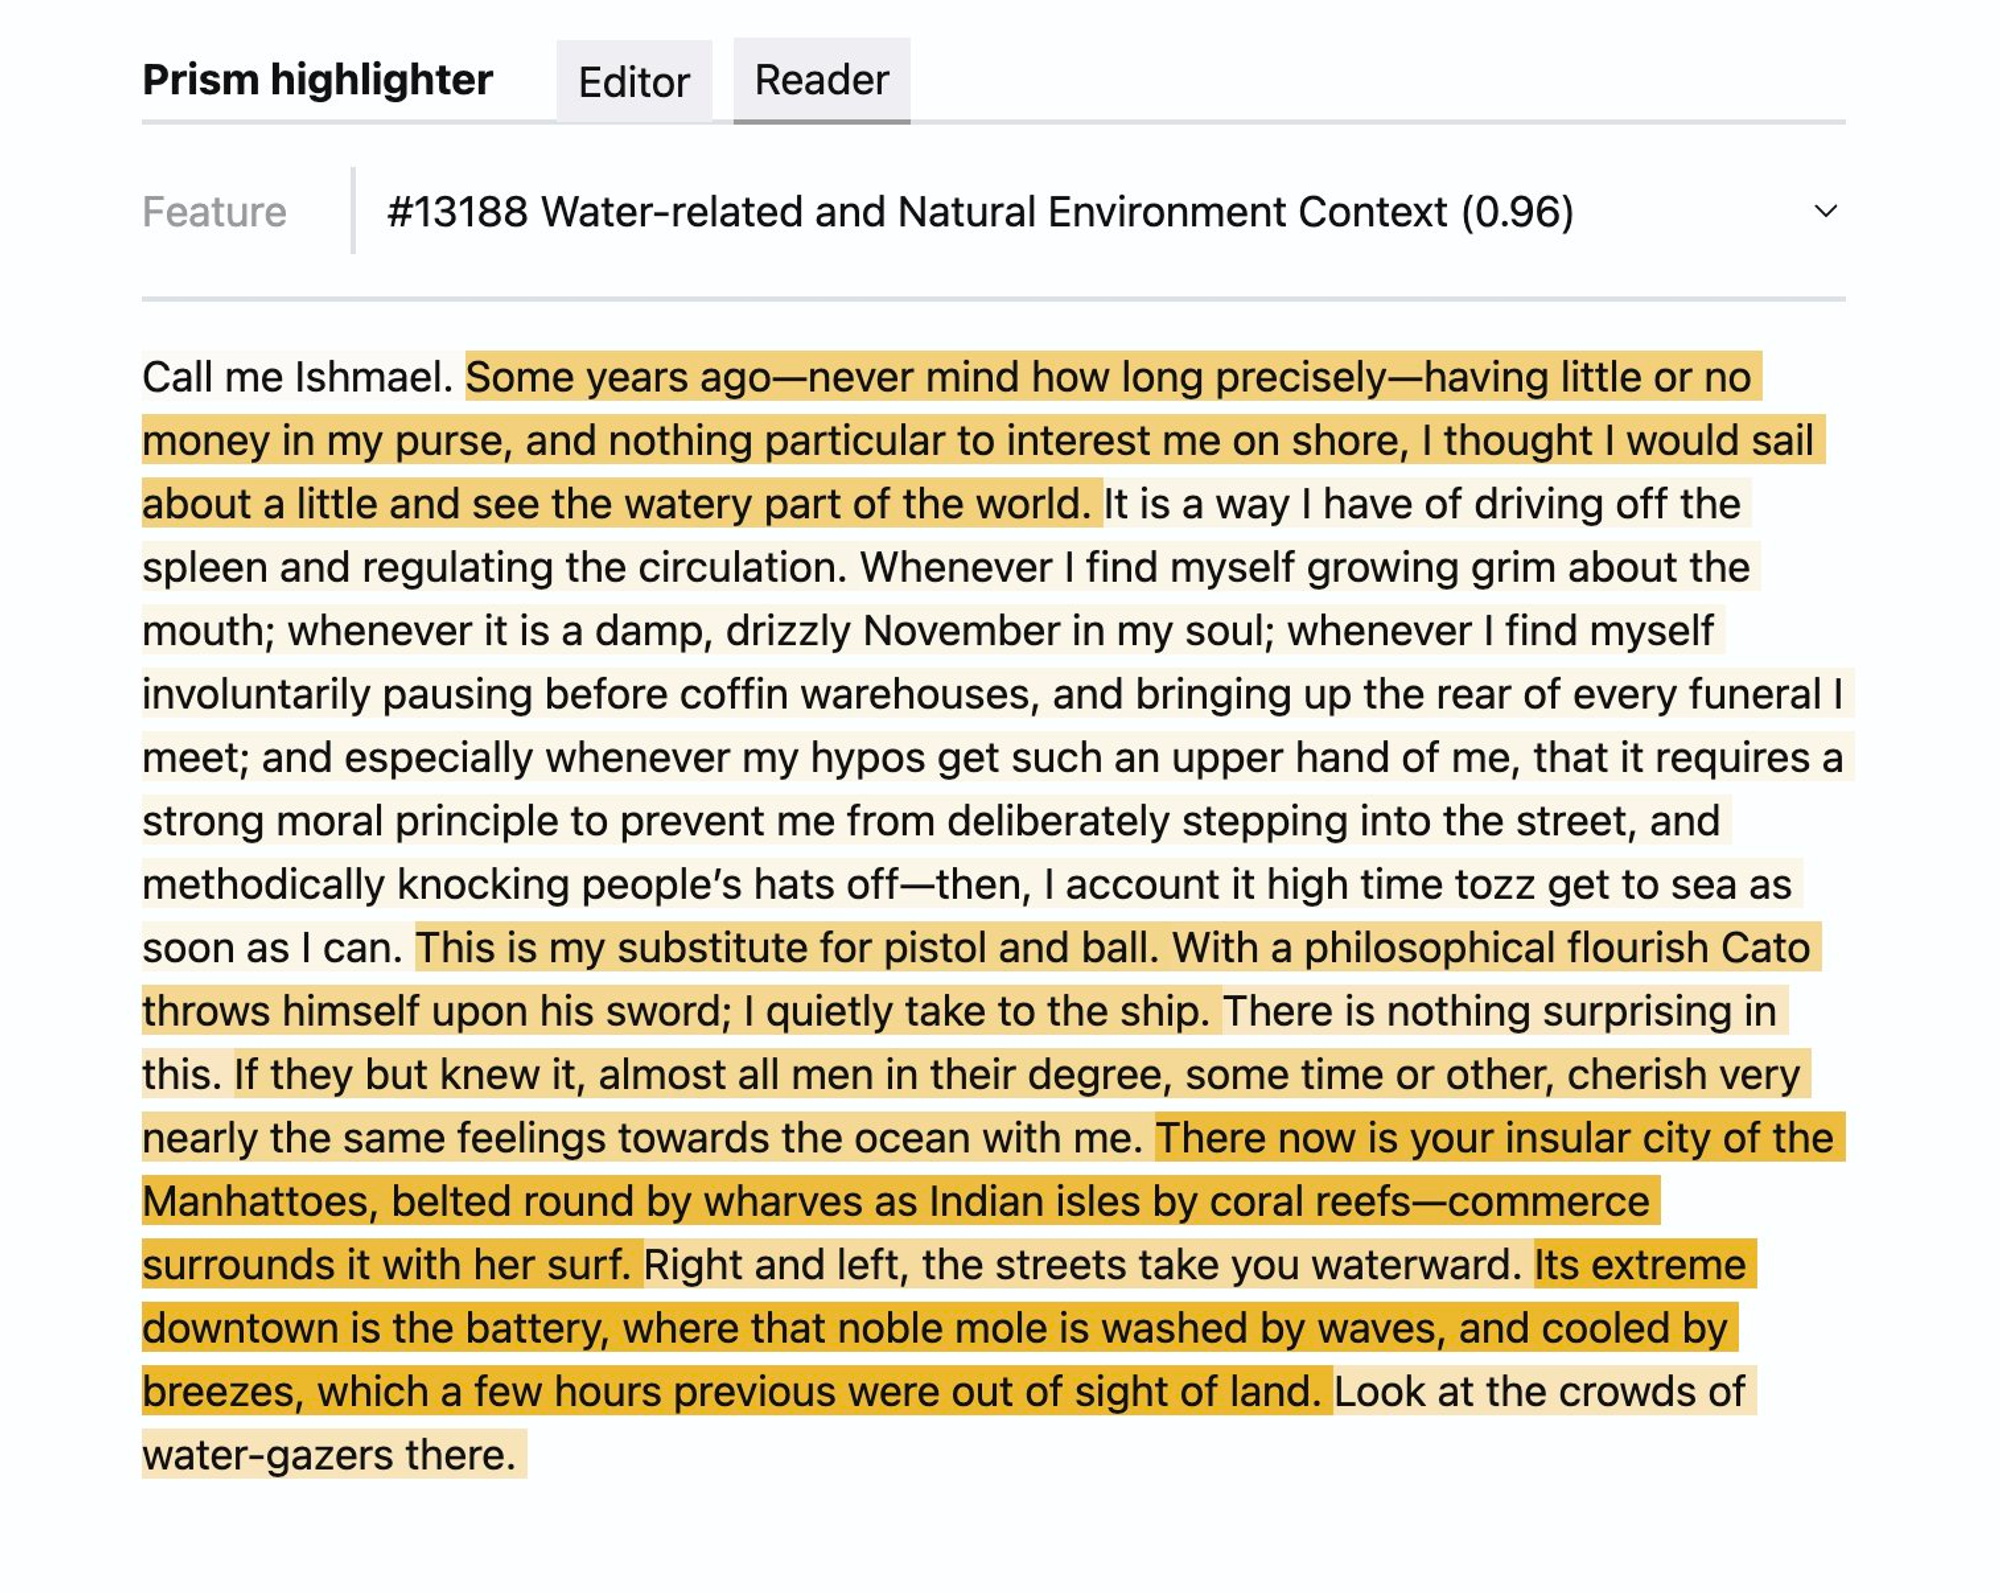
For example, a user might begin with a collection of thousands or even millions of books and PDFs, turn on some filters for specific features like “mention of geopolitical conflict” and “escalating rhetoric”, then quickly zoom in to the highlighted parts to find relevant passages and paragraphs. Compared to a conventional search that flattens all the detail into a single sorted list of a few dozen items, a heatmap lets the user see detail without getting lost in it.
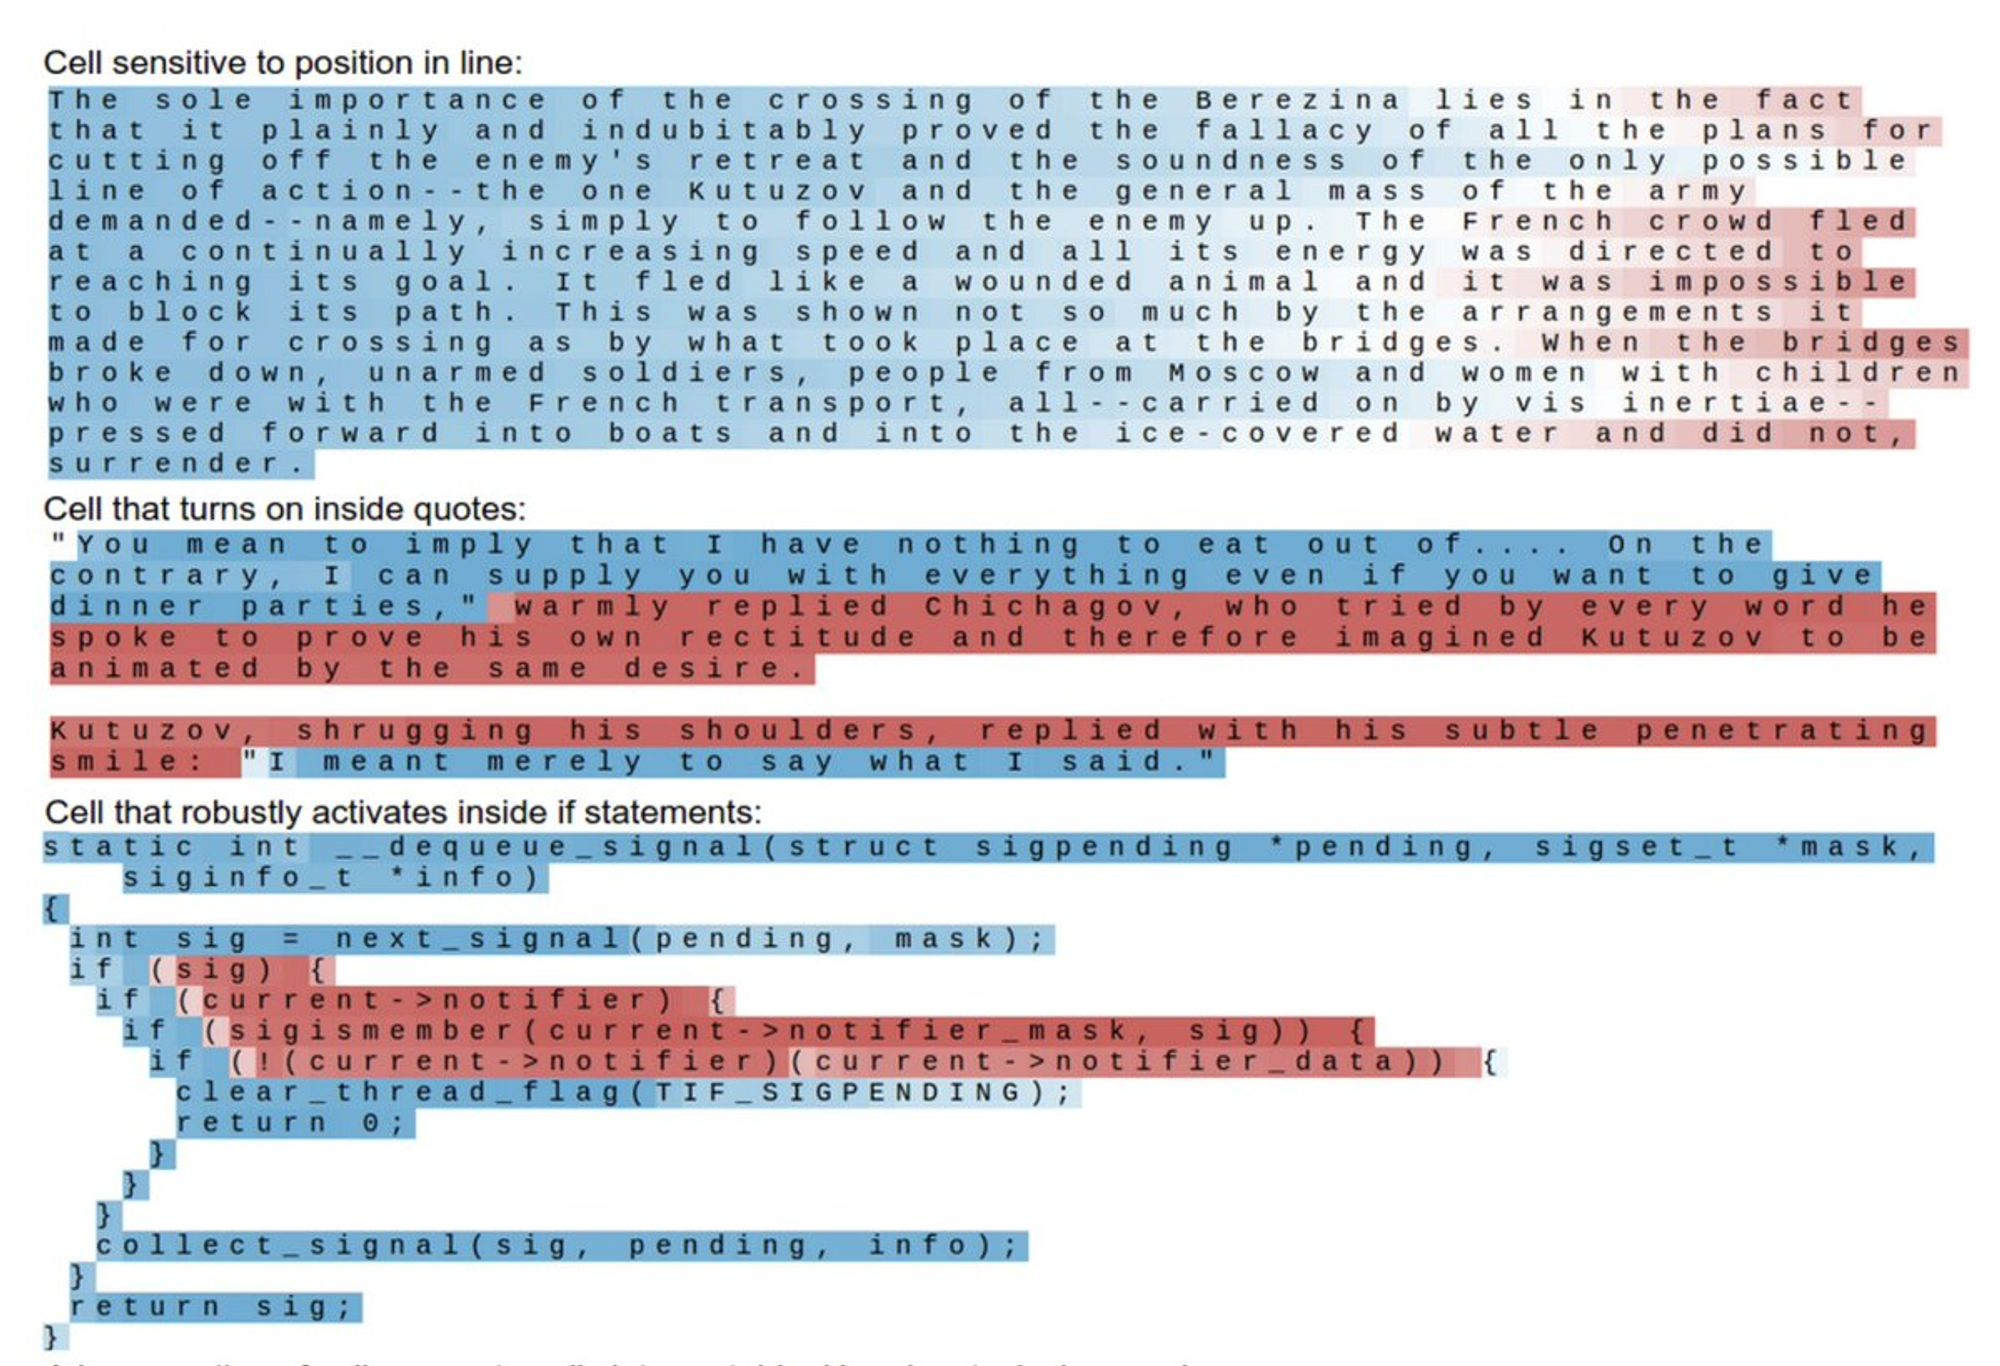
Image from Andrej Karpathy’s The Unreasonable Effectiveness of Recurrent Neural Networks.
Another perspective on the semantic heatmap is semantic syntax highlighting. Just as we highlight program source code to help visually distinguish specific parts of a program, heatmaps and highlights could help humans quickly visually navigate complex document structures.
Spectrograms and track views reveal meaningful patterns across time
In the context of audio processing, a spectrogram visualizes the prominence of different frequency waves within a single stream of audio, and how it evolves over time. In other words, it breaks out the individual mathematically pure components of a sound wave and visualizes each as its own signal over time.
Spectrograms let you visualize sound in a way that communicates much more structure than raw waveforms, by producing a kind of thumbnail of an audio track that breaks out different components like bass lines and rising/falling melodic progressions into distinctive visual patterns.
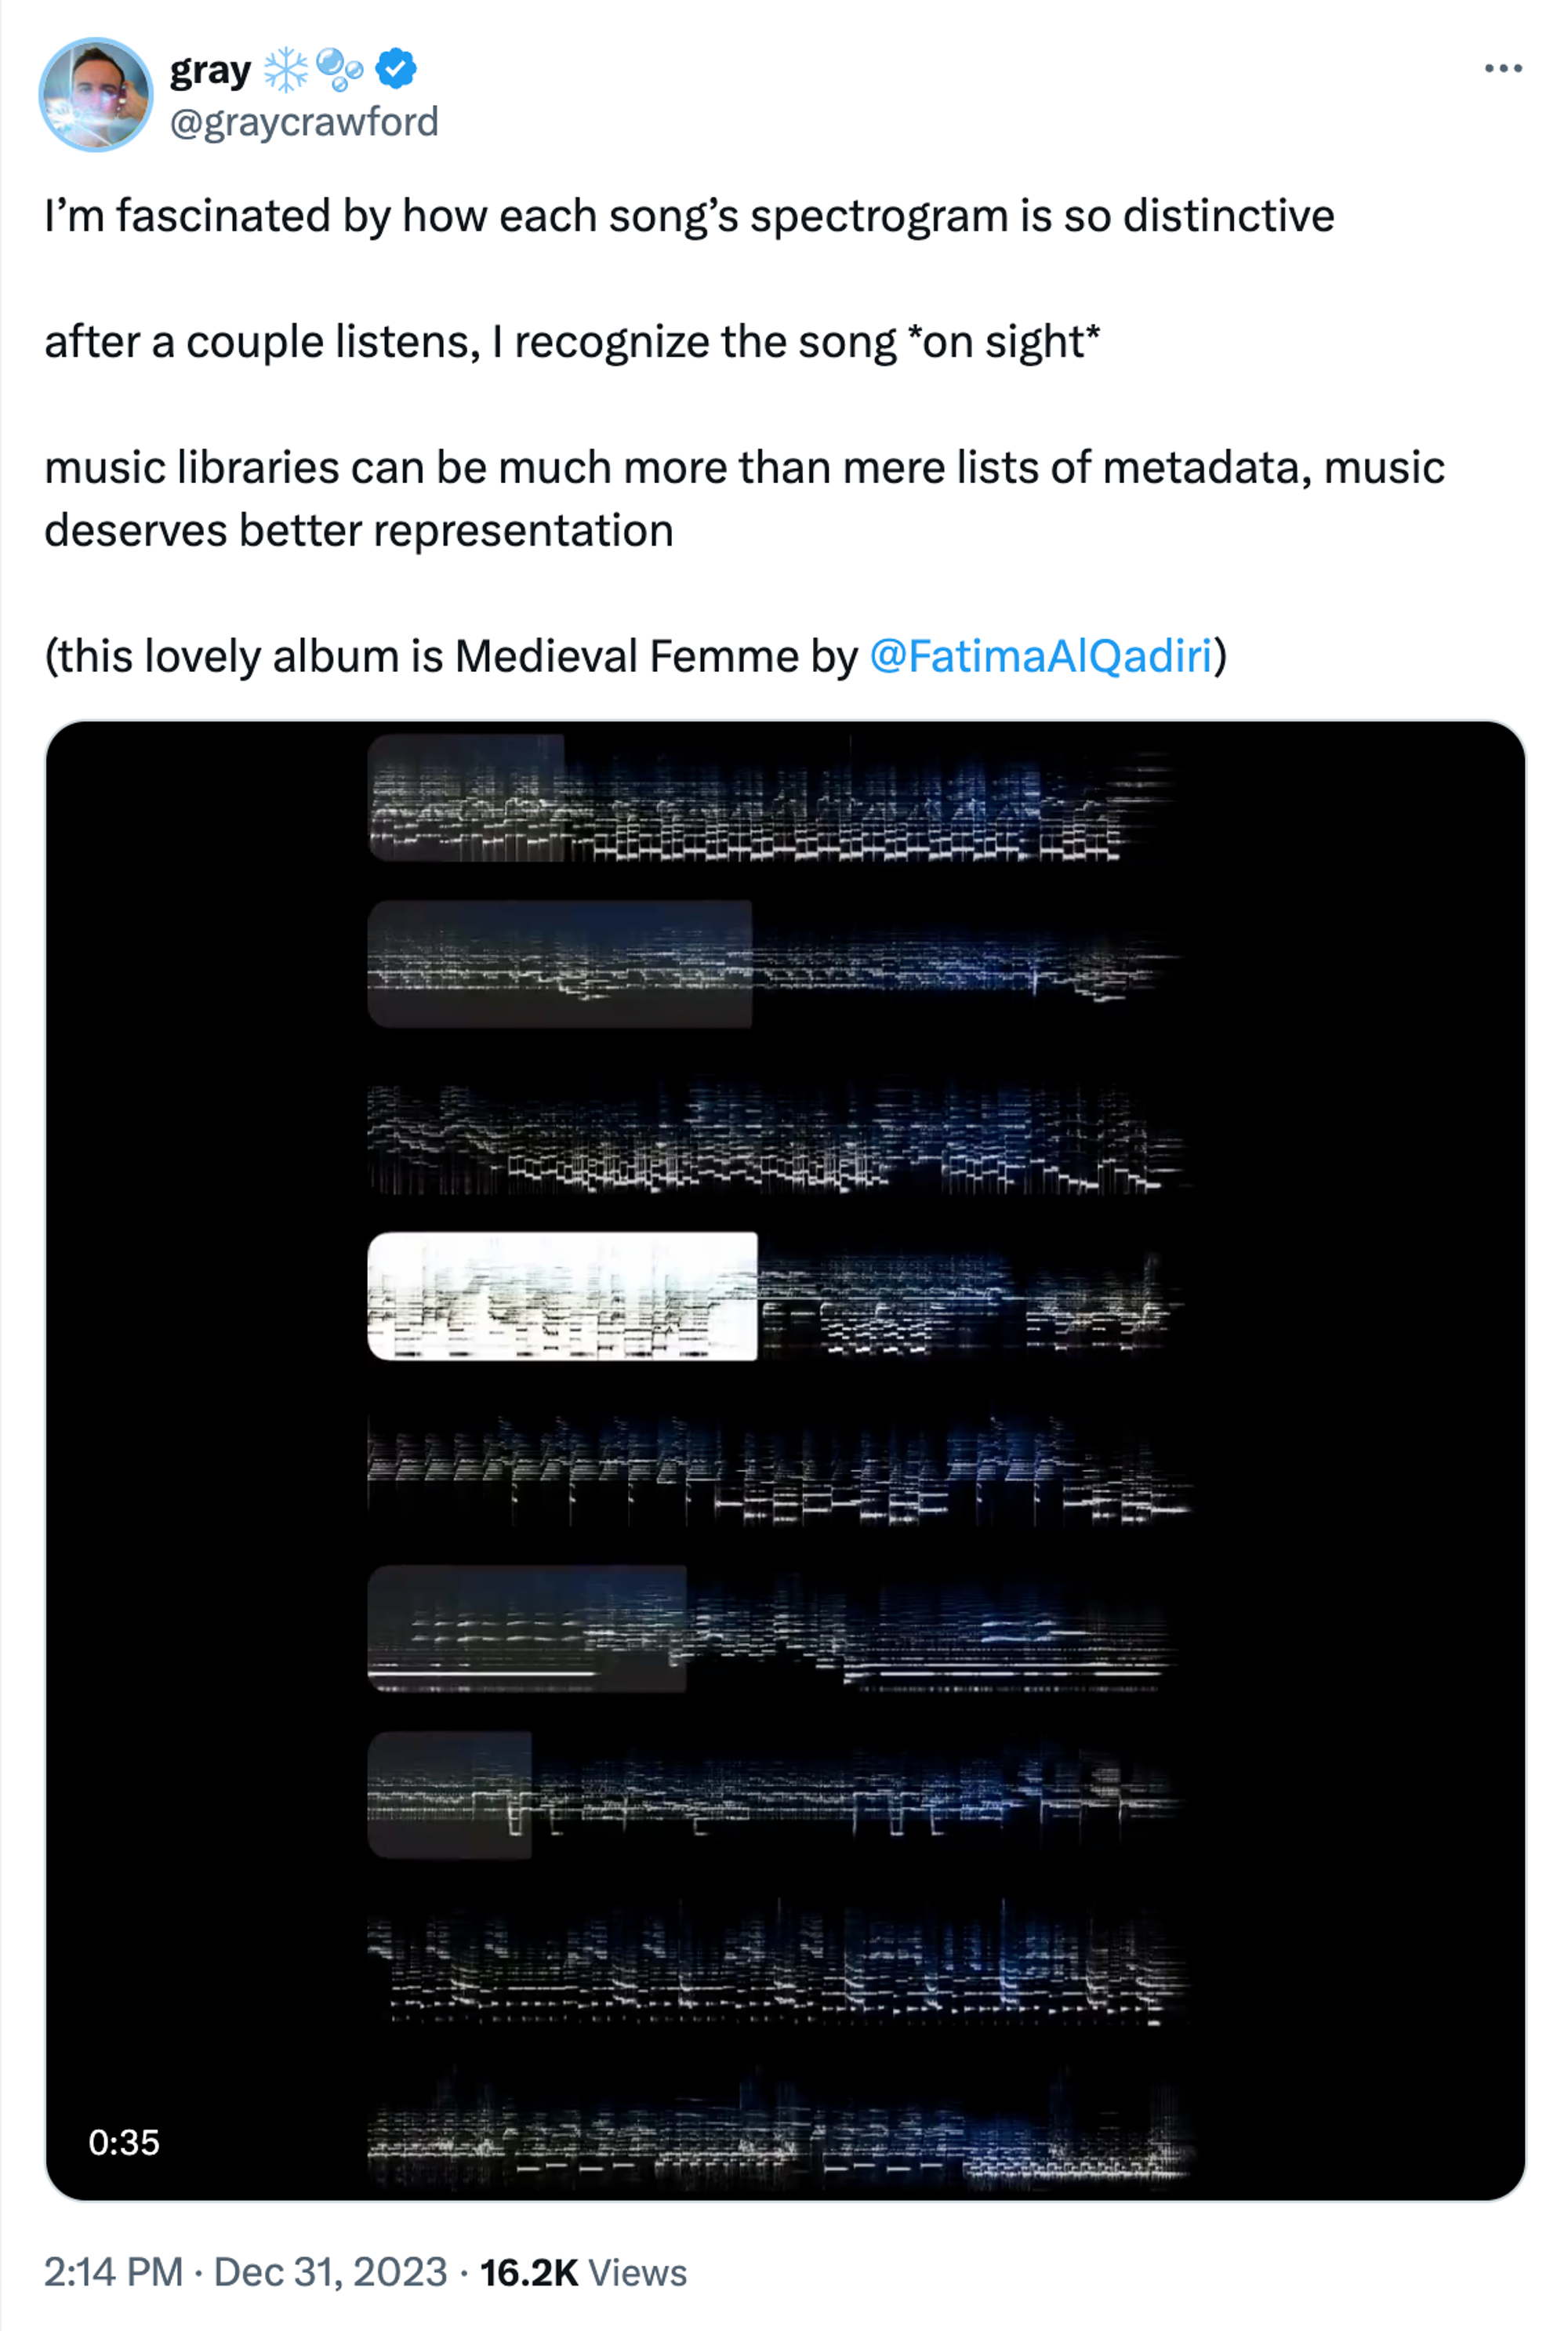
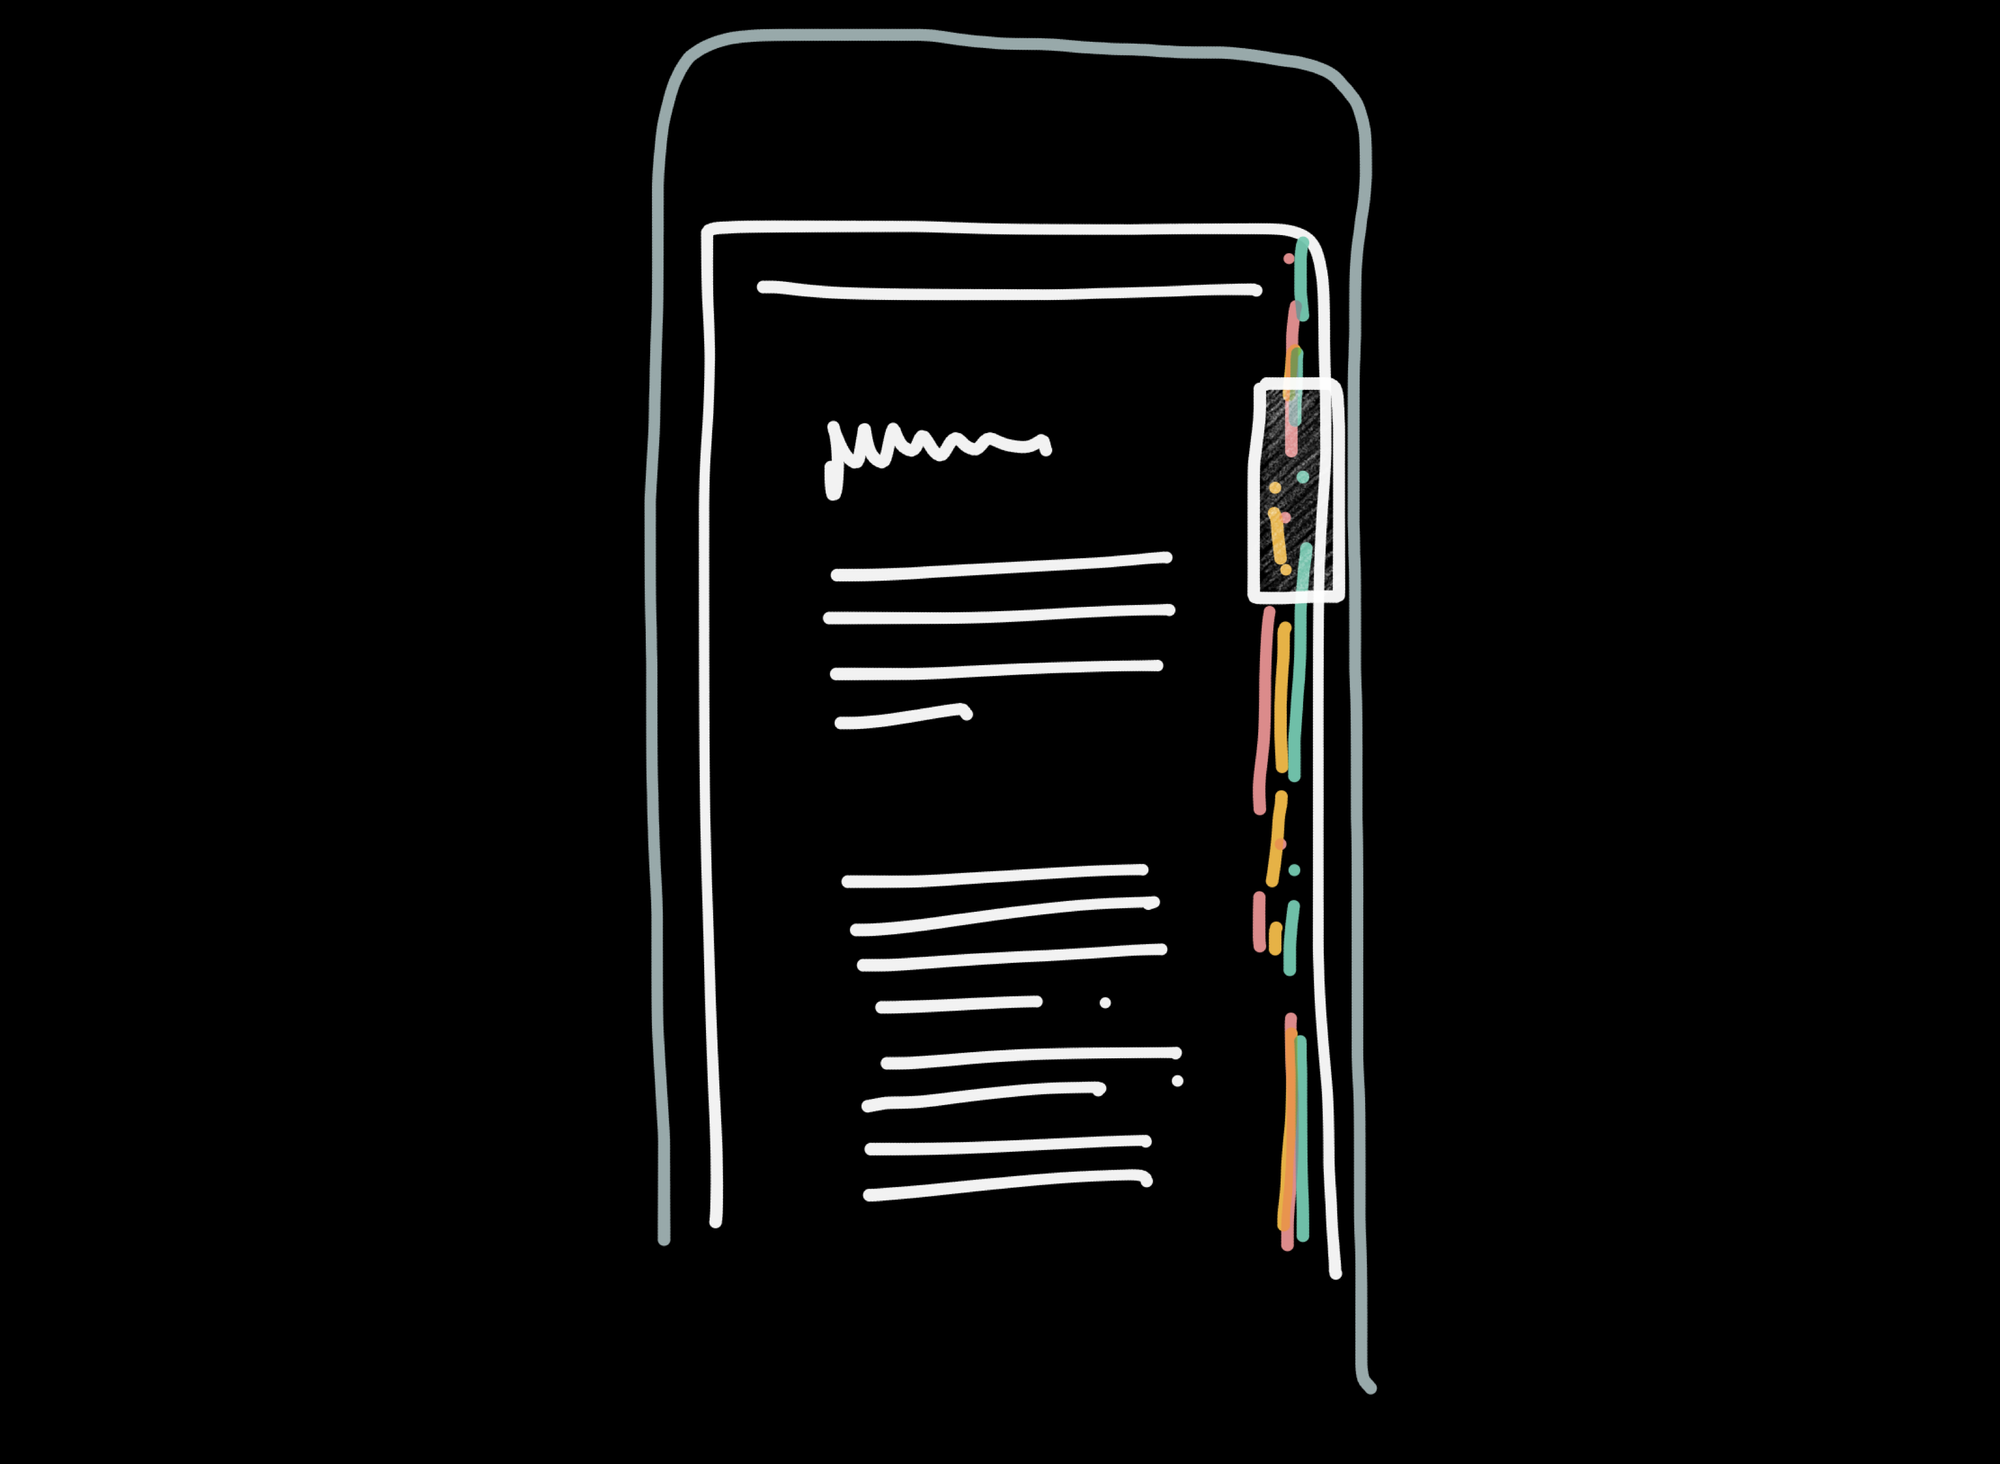
If we apply the same idea to the experience of reading long-form writing, it may look like this. Imagine opening a story on your phone and swiping in from the scrollbar edge to reveal a vertical spectrogram, each “frequency” of the spectrogram representing the prominence of different concepts like sentiment or narrative tension varying over time. Scrubbing over a particular feature “column” could expand it to tell you what the feature is, and which part of the text that feature most correlates with.
We could also take inspiration from a different kind of interface for music, the track view. Music production software like Logic Pro (below) let the user assemble a song from many different tracks, each corresponding to an instrument and processed by different filters and modulations.
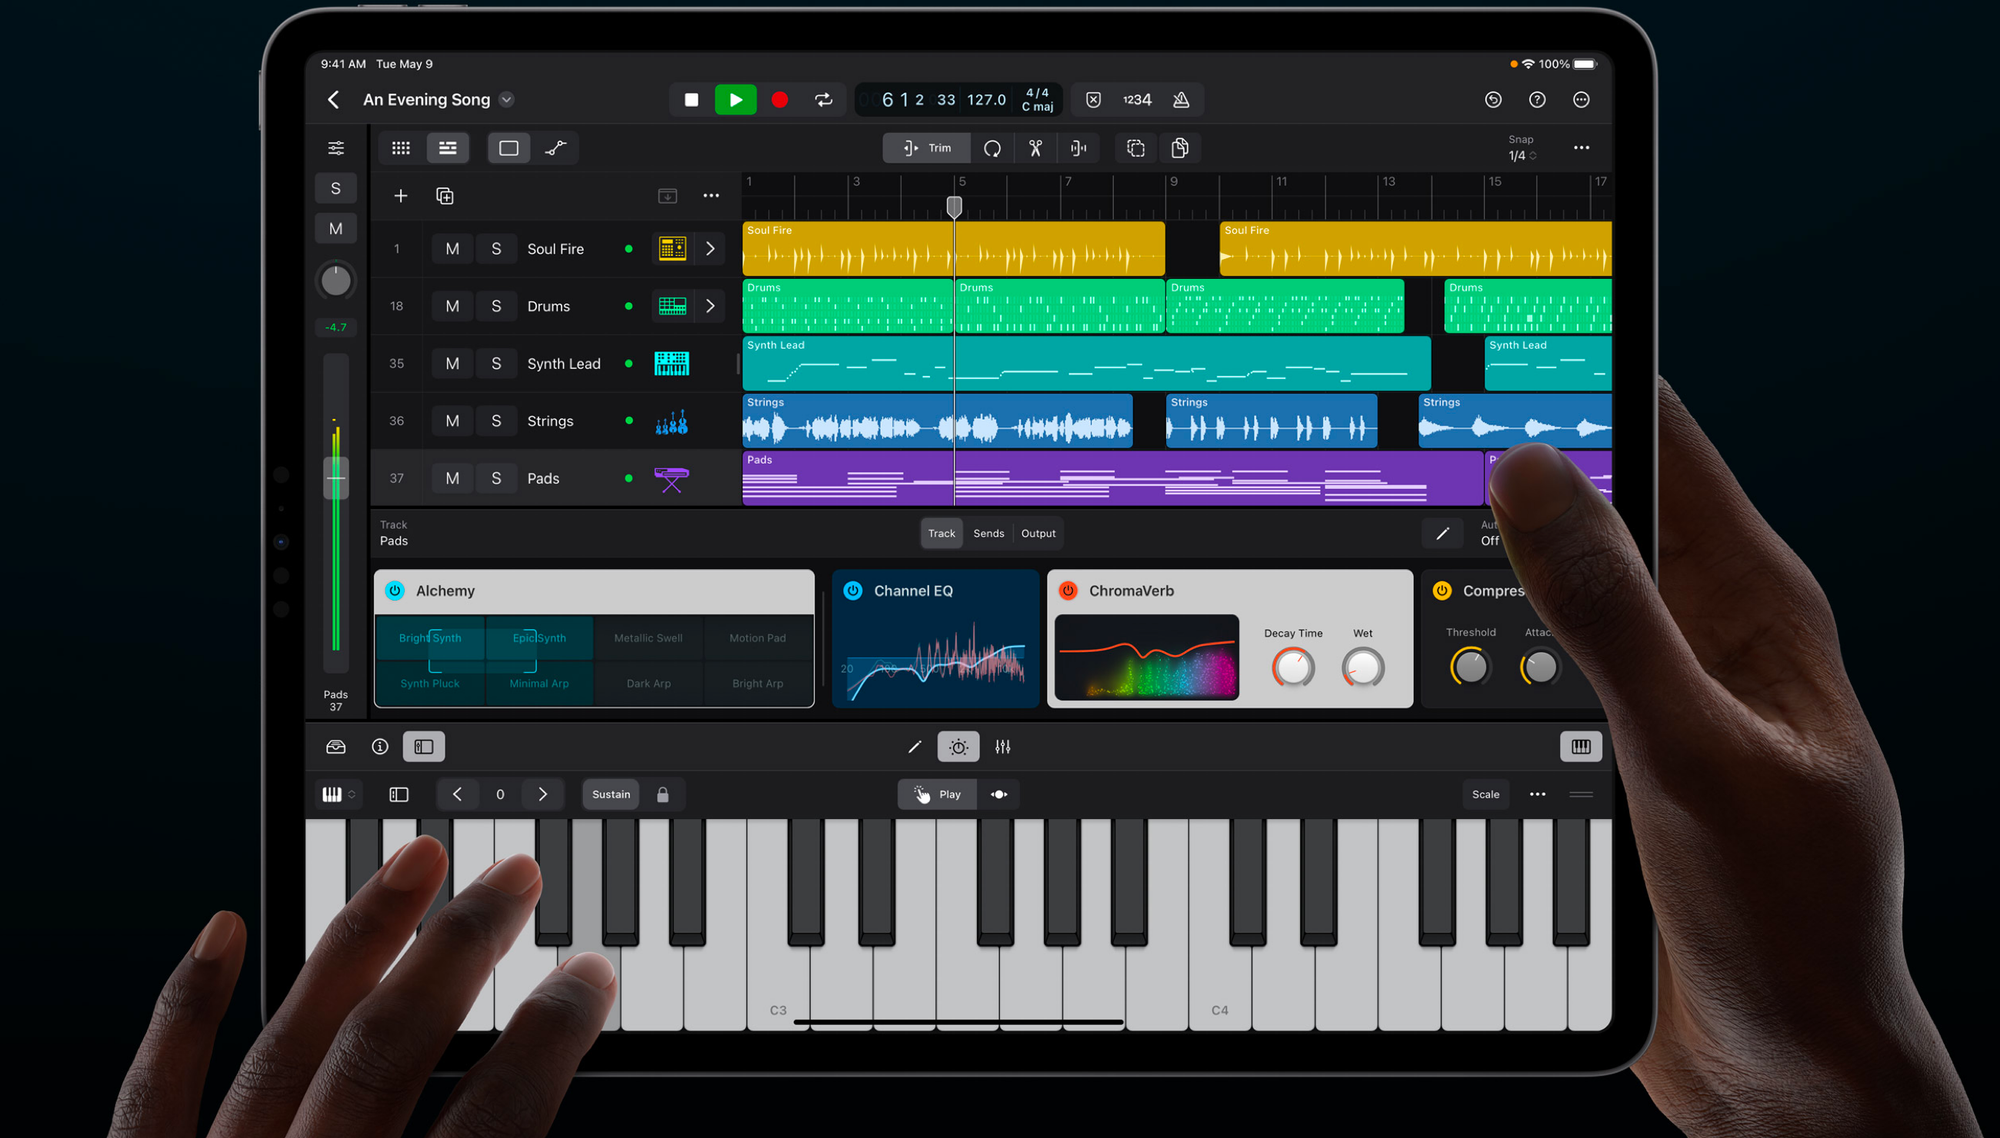
In a writing tool, the whole “song” may correspond to a piece of writing, with each measure a sentence or thought and each instrument track a feature or pre-defined collection of features. The user could modulate each feature (tone, style, technical depth) across time the way a producer may adjust a track’s volume or filter over time, or turn features on and off over certain sentences.
Semantic diffs visualize adjacent possibilities
Take a look at this interactive widget from Red Blob Games’ Predator-Prey article. As I hover over each control, the interface shows me the range of possible forms the subject of my edit can take on as I vary that particular parameter.
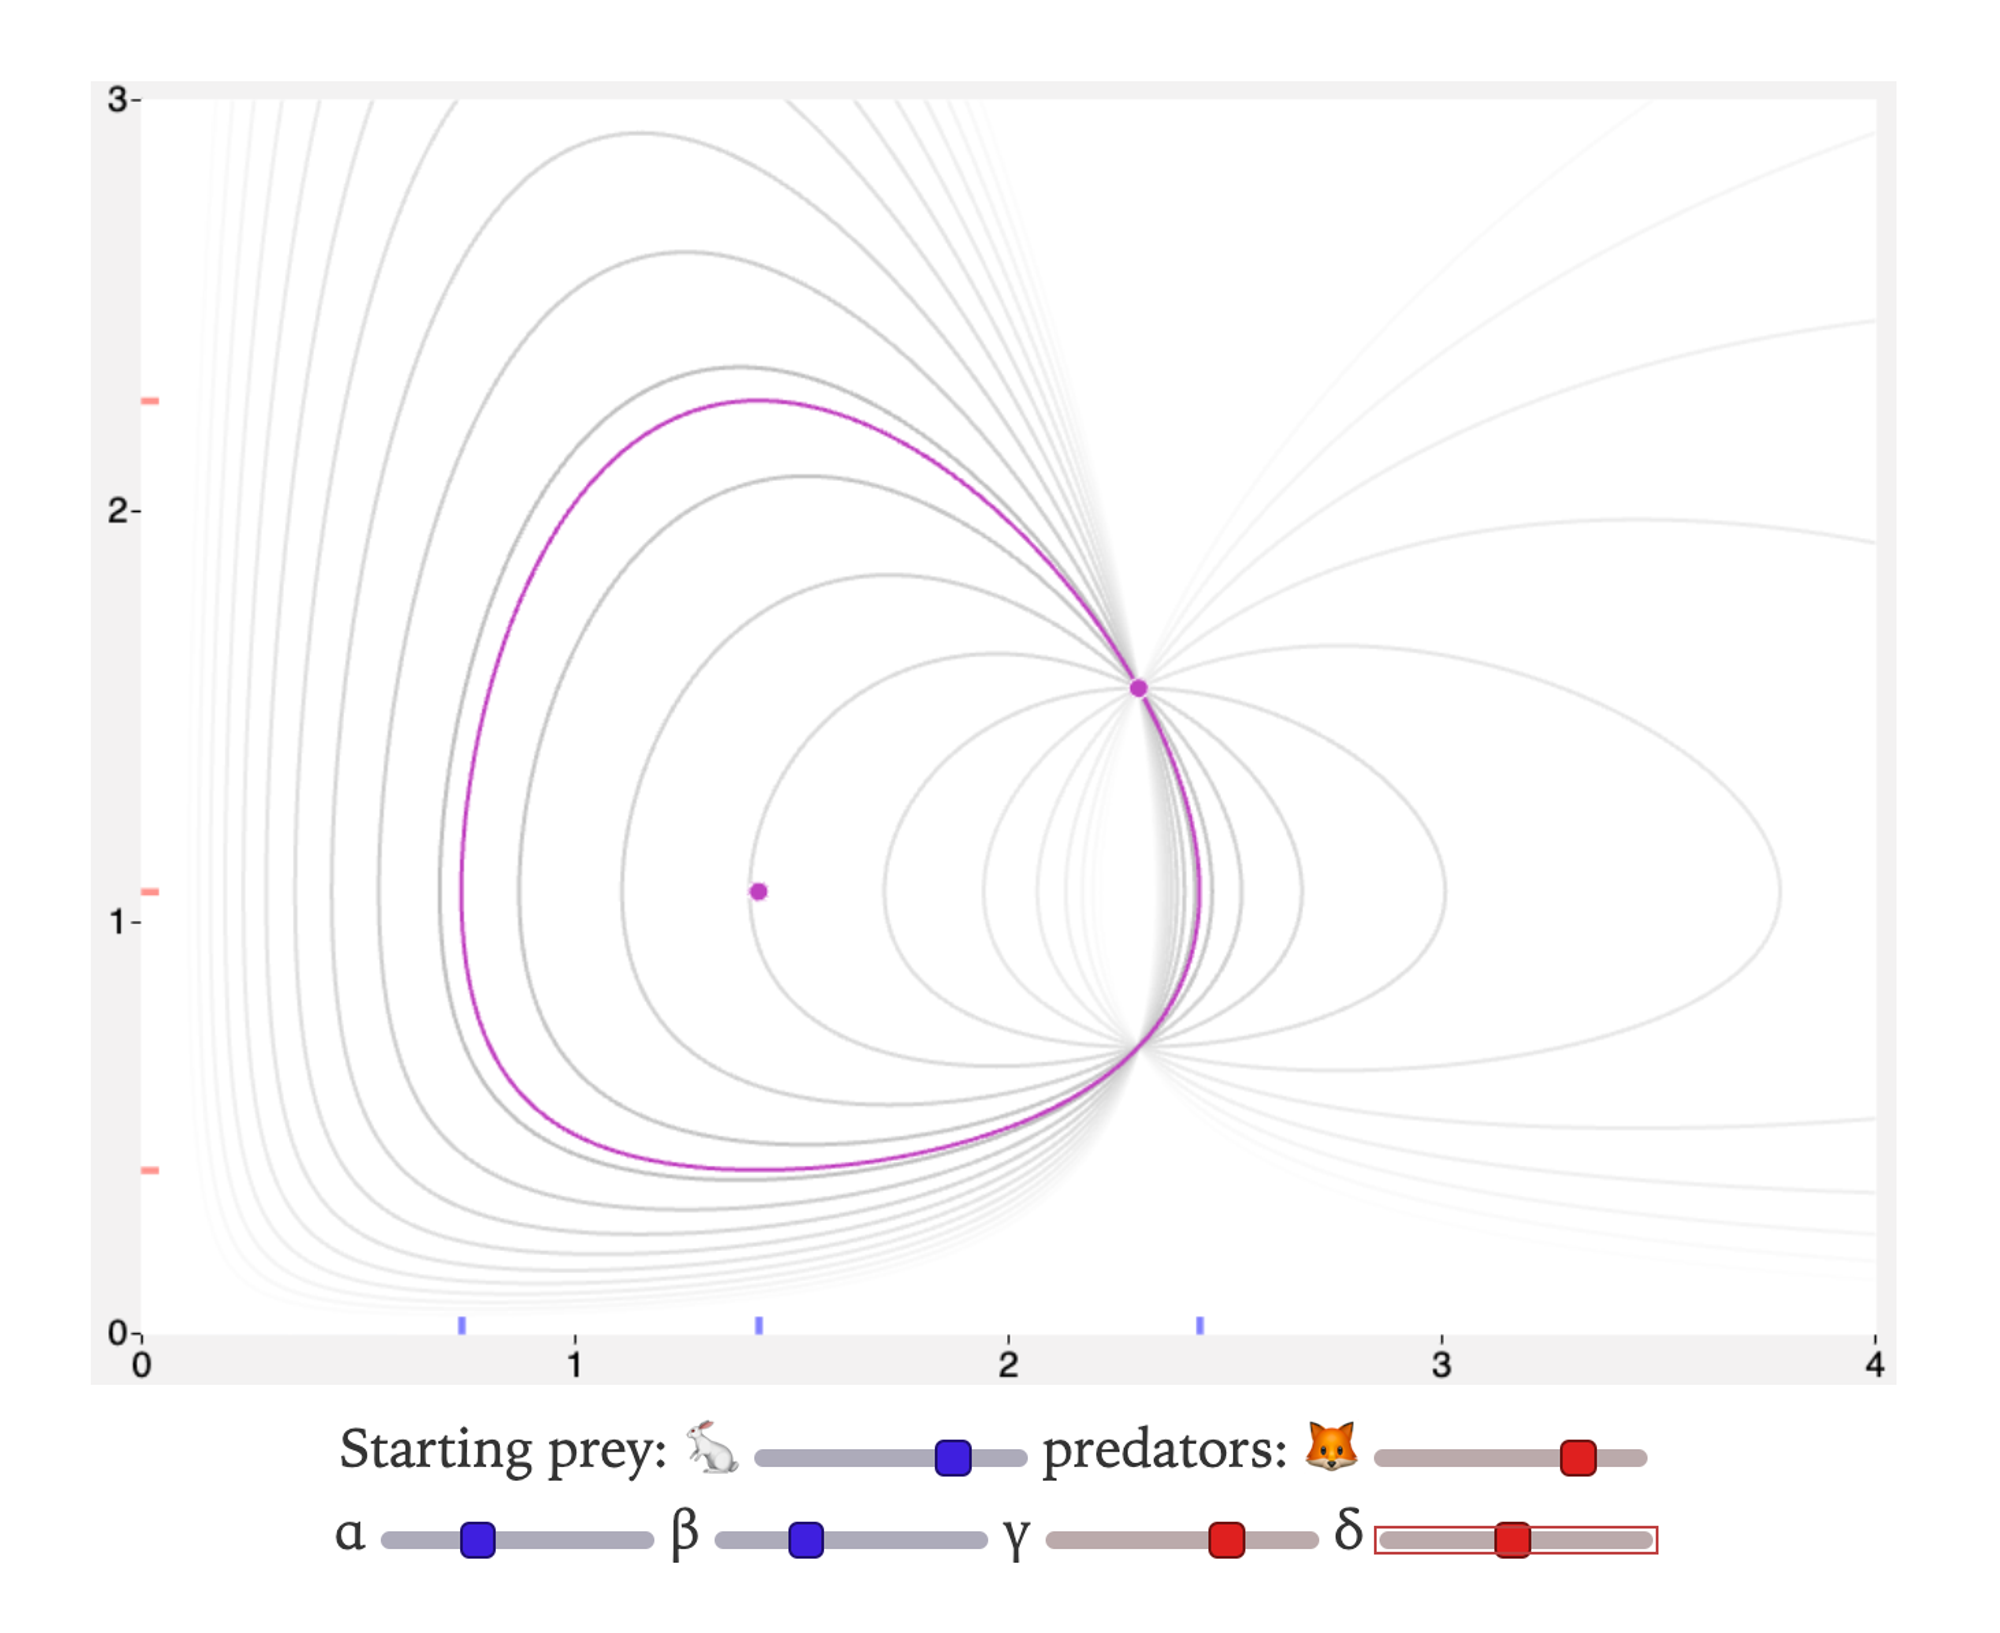
I call this a semantic diff view. It helps visualize how some output or subject of an edit changes when the user modulates some input variable. It shows all the “diffs” between various possible points in the possibility space of outputs, anchored on a particular semantic feature.
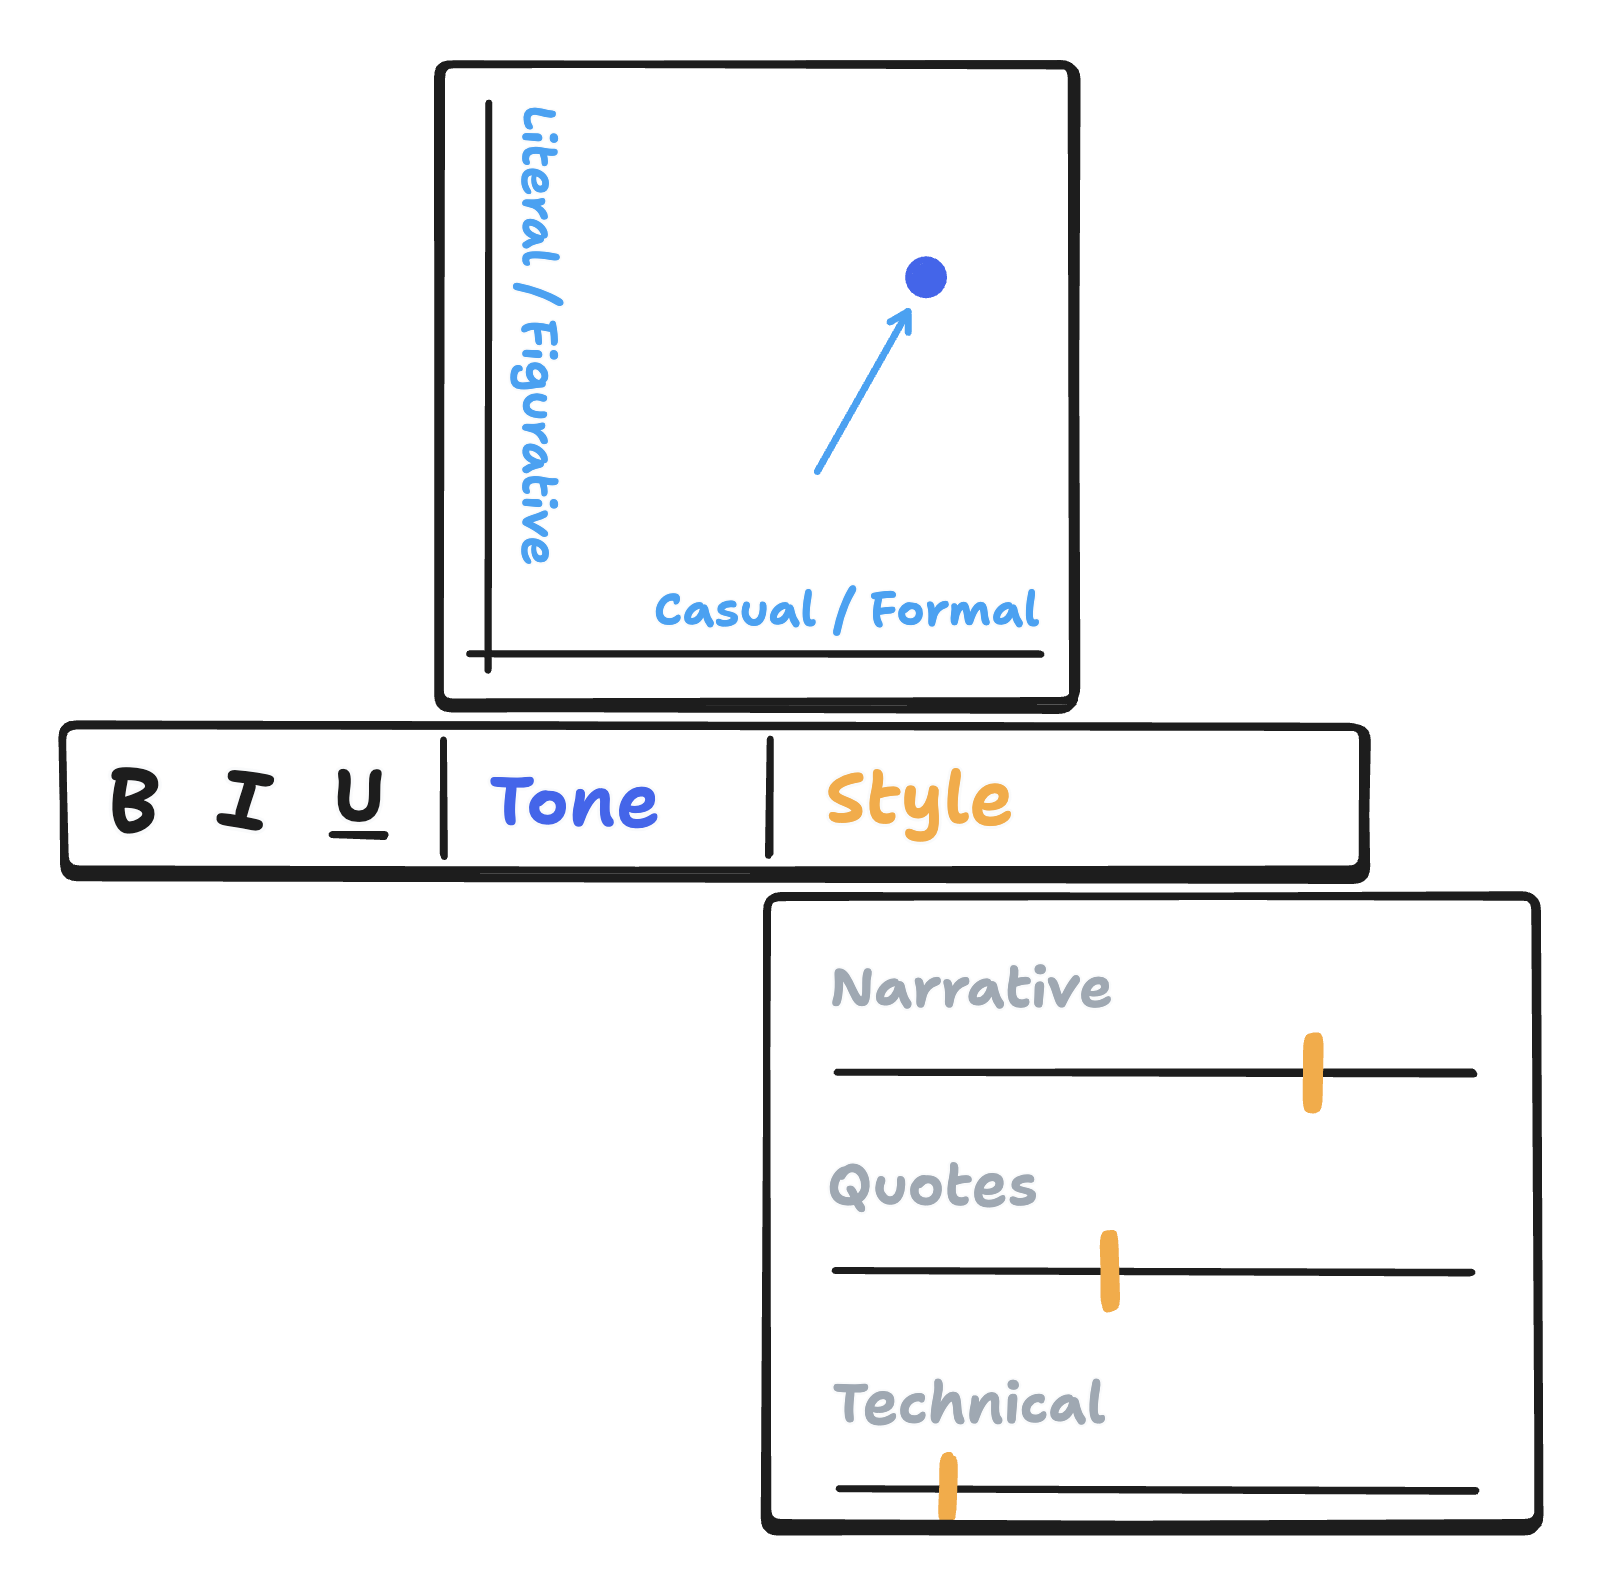
What would a semantic diff view for text look like? Perhaps when I edit text, I’d be able to hover over a control for a particular style or concept feature like “Narrative voice” or “Figurative language”, and my highlighted passage would fan out the options like playing cards in a deck to reveal other “adjacent” sentences I could choose instead. Or, if that involves too much reading, each word could simply be highlighted to indicate whether that word would be more or less likely to appear in a sentence that was more “narrative” or more “figurative” — a kind of highlight-based indicator for the direction of a semantic edit.
Icons and glyphs for new concepts discovered in neural networks
In Interpreting and Steering Features in Images, the author proposes the idea of a “feature icon”, a nearly-blank image modified to strongly express a particular feature drawn from a computer vision model, like specific lighting, colors, patterns, and subjects. He writes:
To quickly compare features, we also found it useful to apply the feature to a standard template to generate a reference photo for human comparison. We call this the feature expression icon, or just the icon for short. We include it as part of the human-interpretable reference to this feature.
Here are some examples of feature expression icons from that piece.
![]()
I found this to be the most interesting part of this particular work. Browsing through these icons felt as if we were inventing a new kind of word, or a new notation for visual concepts mediated by neural networks. This could allow us to communicate about abstract concepts and patterns found in the wild that may not correspond to any word in our dictionary today.
In Imagining better interfaces to language models, I pointed out a major challenge in designing latent space-based information interfaces: high dimensionality.
The primary interface challenge here is one of dimensionality: the “space of meaning” that large language models construct in training is hundreds and thousands of dimensions large, and humans struggle to navigate spaces more than 3-4 dimensions deep. What visual and sensory tricks can we use to coax our visual-perceptual systems to understand and manipulate objects in higher dimensions?
One way to solve this problem may involve inventing new notation, whether as literal iconic representations of visual ideas or as some more abstract system of symbols.
A concept library for sharing and collaborating on units of meaning and style
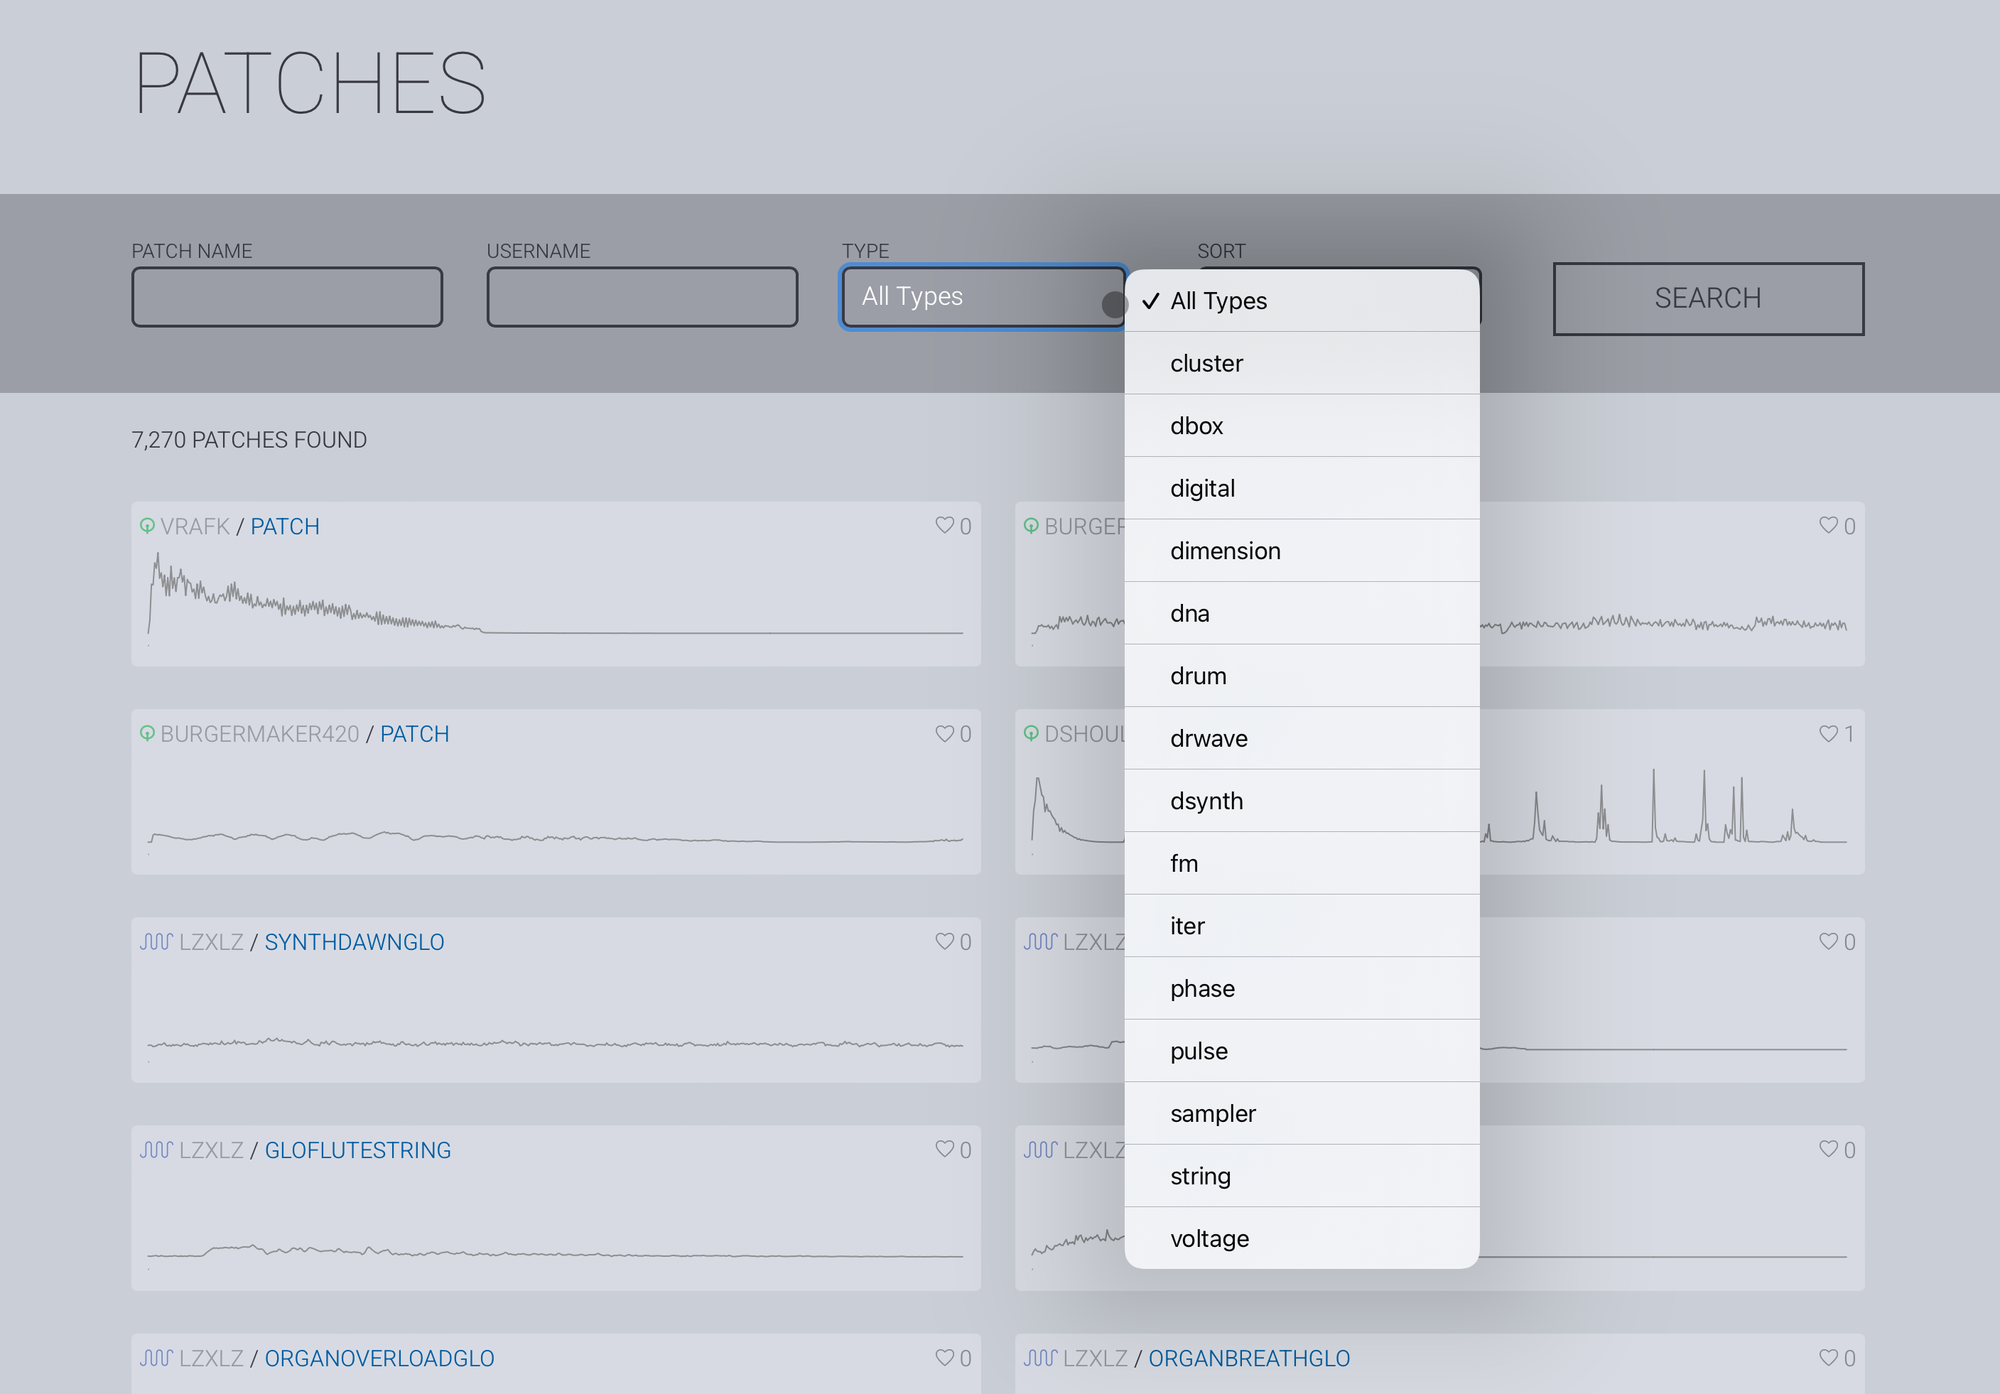
In the user community for a particular modular synth called the OP-1, there’s a website called op1.fun that hosts a huge library of samples (playable sounds) that anyone can download and incorporate into their practice. Even as a complete stranger to this community, it was surprisingly fun to browse around and explore different kinds of sounds in the library of sound patches.
Similar kinds of marketplaces and libraries exist for other creative professions. Photographers buy and sell filters, and cinematographers share and download LUTs to emulate specific color grading styles. If we squint, we can also imagine software developers and their package repositories like NPM to be something similar — a global, shared resource of abstractions anyone can download and incorporate into their work instantly.
No such thing exists for thinking and writing.
As we figure out ways to extract elements of writing style from language models, we may be able to build a similar kind of shared library for linguistic features anyone can download and apply to their thinking and writing. A catalogue of narrative voice, speaking tone, or flavor of figurative language sampled from the wild or hand-engineered from raw neural network features and shared for everyone else to use.
We’re starting to see something like this already. Today, when users interact with conversational language models like ChatGPT, they may instruct, “Explain this to me like Richard Feynman.” In that interaction, they’re invoking some style the model has learned during its training. Users today may share these prompts, which we can think of as “writing filters”, with their friends and coworkers. This kind of an interaction becomes much more powerful in the space of interpretable features, because features can be combined together much more cleanly than textual instructions in prompts.
A new history of the word
For most of the history of writing, humans produced words out of natural thought — taking in some ideas, mixing it with our memories and intuitions and logic, and vocalizing what came to us in our minds. Until two things happened.
- We understood the physics of ideas. An idea is composed of concepts in a vector space of features, and a vector space is a kind of marvelous mathematical object that we can write theorems and prove things about and deeply and fundamentally understand.
- We learned to relate our mathematical models of writing to ideas in the real world. We built devices to take writing and decompose it into its constituent fundamental ideas. We also invented a way to turn that mathematical model of a thought back into real words we could read, using piles and piles of compute.
Once we started understanding writing as a mathematical object, our vocabulary for talking about ideas expanded in depth and precision. We could imagine new ideas and metaphors as mathematical constructs, and then conjure them into words, creating entirely new kinds of knowledge tools we could never have created with natural materials. Not only that, backed by our mathematical model of ideas, we could systematically explore the space of what’s possible to imagine.
The instrument that results…?
← Prism: mapping interpretable concepts and features in a latent space of language
I share new posts on my newsletter. If you liked this one, you should consider joining the list.
Have a comment or response? You can email me.