I dabbled in two small side projects recently that relate to the idea of probabilities in written language. Neither of them are particularly practical, but I had fun making them and they seem to produce interesting results, so I thought I’d write about them here.
Wintermute
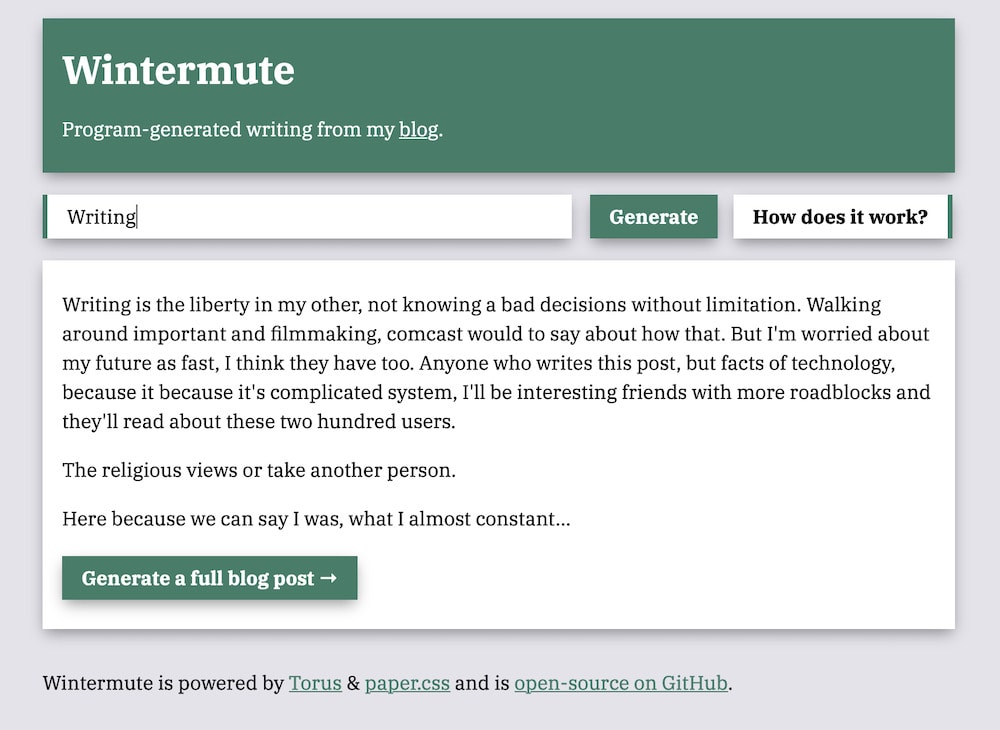
Wintermute is a fake blog generator based on the corpus of text on this very blog. It operates in two modes. either as an API that generates some text based on a starting word, as below:
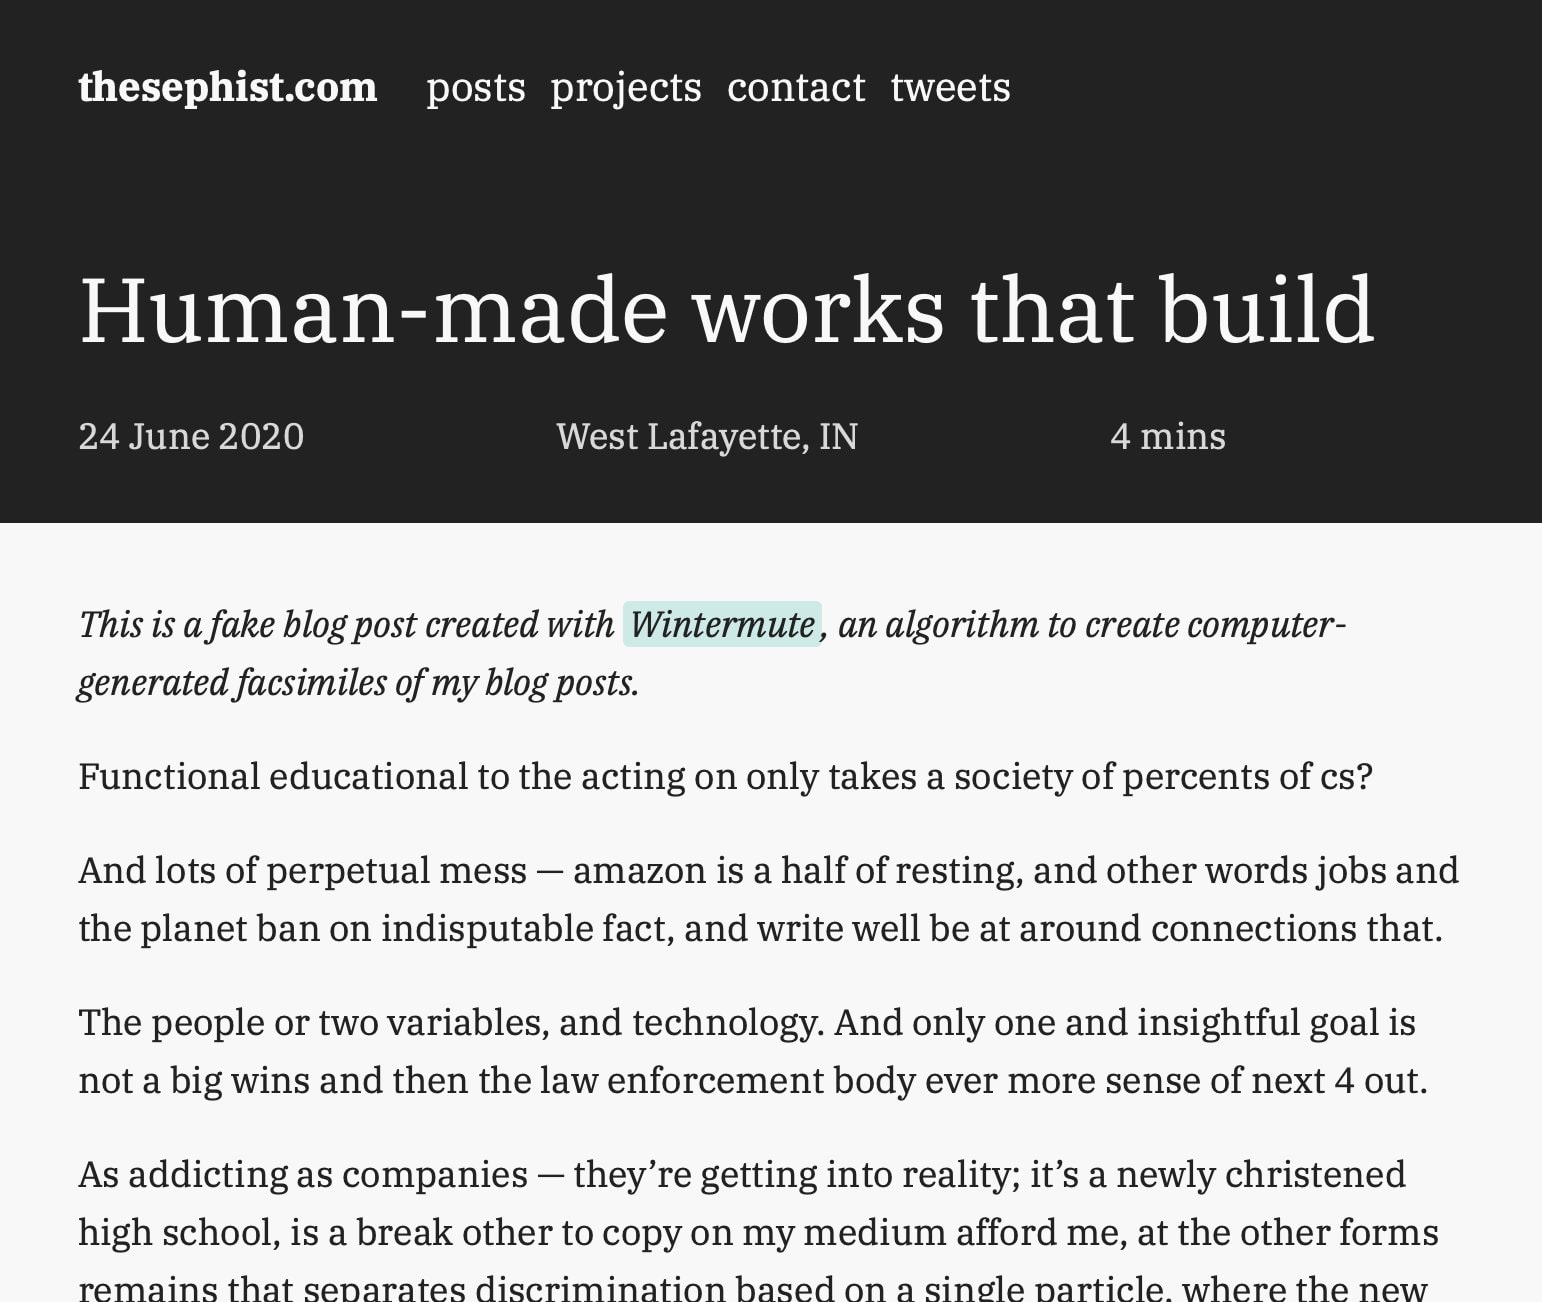
… or as a tool to generate full facsimile pages consistent with this blog’s current style, like this:
Wintermute uses Markov chain Monte Carlo simulations to construct a probabilistic model of my past writing, and create new sentences. Although not as realistic as, say, OpenAI’s GPT-2, this method is trivial to implement, fast, and works well enough to be interesting. It was also simple to deploy the solution as a single static Go binary to my server.
Wintermute is open source on GitHub, and you can see the code in the repository.
Word plotter
Wintermute deals with probabilities of words following other words, but what about the odds of letters following other letters? Word plotter investigates this line of thinking. But rather than trying to generate new text, this tool simply creates a data visualization, a table of probabilities of letters following other letters. A larger, darker circle at row X, column Y represents a higher chance of Y immediately following X.
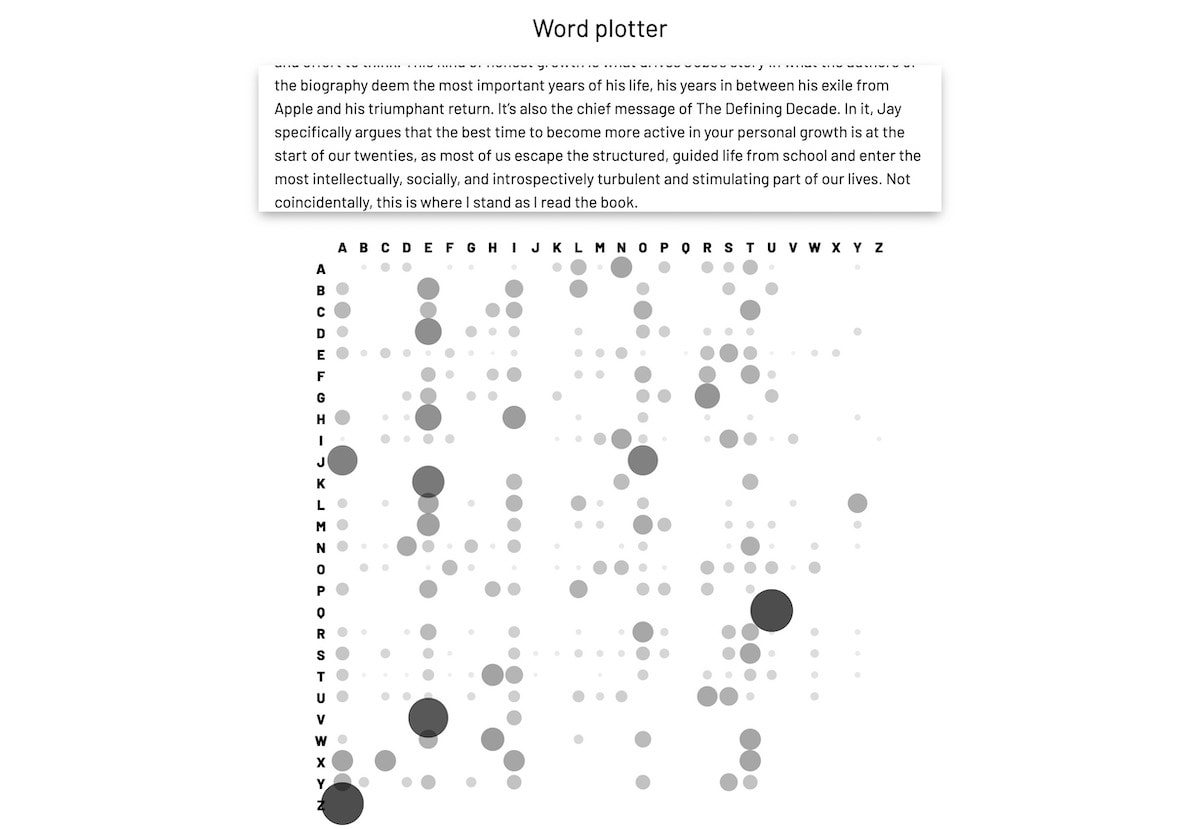
The plot changes in real time as you type text into the input field. You can see a demo of the dynamic visualization in action in this gif.
One of the interesting experiments we can do with this tool is to study the visualization from source texts in different languages or settings. A source text in German, for example, produces a very different visualization from one in Swahili or French or Spanish. They share the same alphabet, but 2-grams common in Germanic languages like “st” and “ie” occur relatively less often in other languages, while there are also more universal 2-grams, like “qu”, that occur frequently in most languages of a language family.
Here, we have the word plots of the same source text, an excerpt of my blog post Finding it, in four different languages.
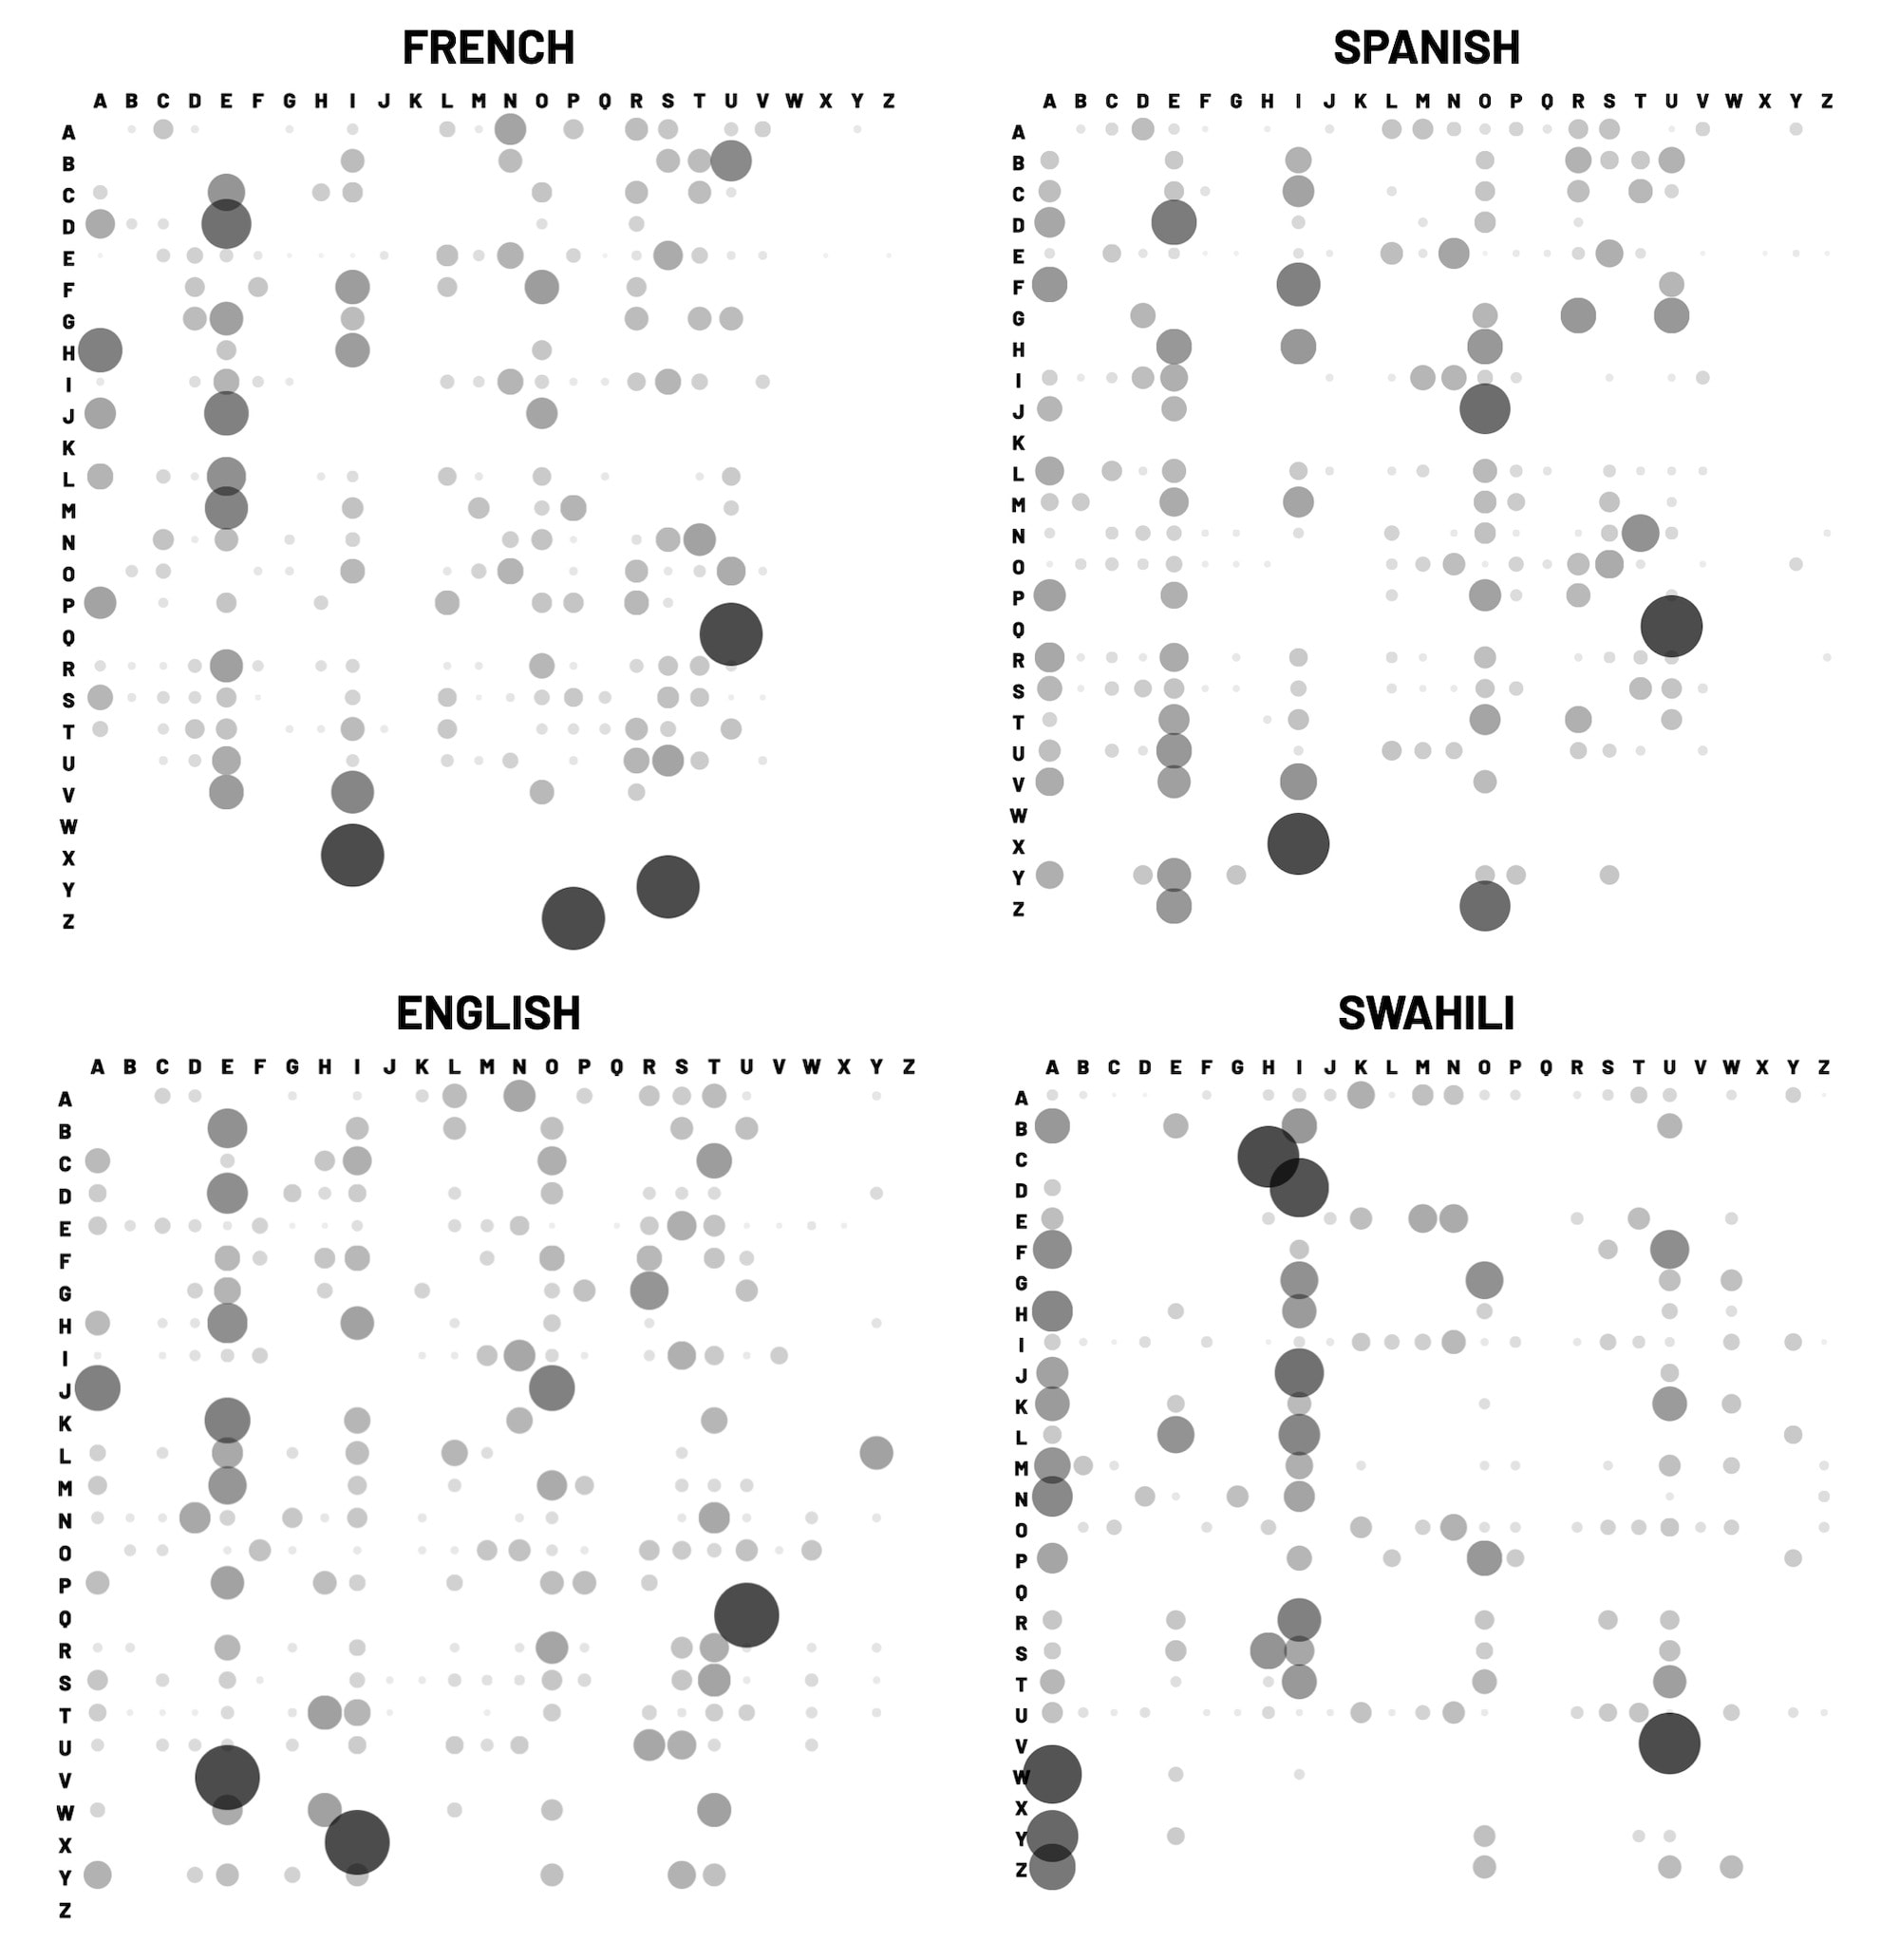
There are a few specific trends we can notice in these plots.
- The 2-gram “qu” occurs often – “u” almost always follows “q” – in every Indo-European language, but not Swahili.
- Swahili displays vertical “streaks” under the letters “a” and “u” – the two common vowels following consonants in the language. These streaks are unique to Swahili, and the European languages have stronger streaks around “e” and “i”.
- The plots for English and French are more noisy, and Spanish and Swahili plots are cleaner. My interpretation of this pattern is that English and French have more variety in common letter combinations – more diphthongs and common consonant groups.
I think these are pretty interesting patterns to notice visually, and I’m curious about other inter-language patterns that we could discover in plots like this.
Word plotter is open source on Codeframe, my frontend web IDE. You can find the code by following this editor link.
← Lovecroft: a mailing list manager for static sites
I share new posts on my newsletter. If you liked this one, you should consider joining the list.
Have a comment or response? You can email me.